


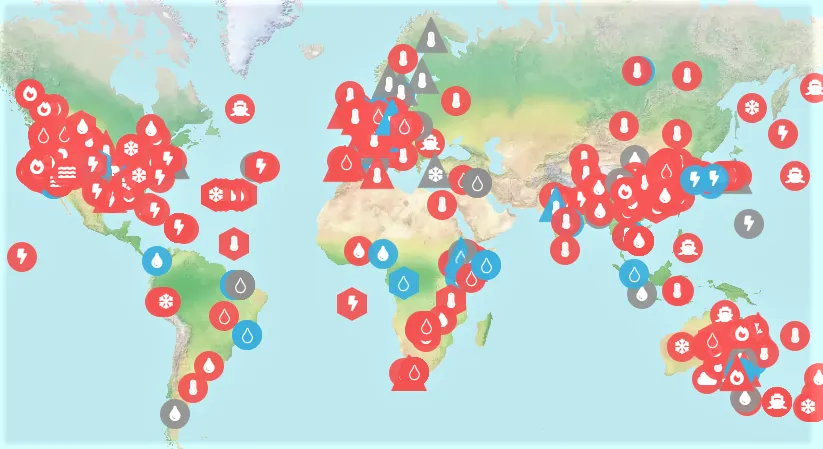
Map of extreme weather attribuition studies from Carbon Brief
When climate change is presented as average warming across the whole surface of the planet, it may not sound that dangerous. How much difference can an extra degree or two make after all? But this is to overlook two things. Firstly, some regions, for example the Arctic and much of Africa, experience disproportionate heating. Also, these temperature shifts can make big changes to weather patterns, leading to more extreme and more variable weather. The number of climate disasters (storms, floods, landslides, extreme heat, drought and wildfire) has increased five-fold over recent decades. In the 1970s, 711 were recorded, but this number increased to 3536 in the 2000s and 3165 in the 2010s.
A decade ago, experts would explain that extreme weather disasters would increase with global warming, and that we had already 'loaded the dice', shifting the probability towards these being more severe. But they would generally refuse to say that any particular event was 'caused by' climate change. However we can now be much clearer about what 'loading the dice' might mean for any particular event. For example, last summer's record-breaking heatwave in western Canada and the US was "virtually impossible without human-caused climate change".
The World Weather Attribution initiative has been important in analysing these events quickly after they happen, using rigorous methods but avoiding the usual delay of years for scientific research publication. There is also a comprehensive overview of all the research carried out on extreme weather attribution by Carbon Brief, last updated February 2021 (the map from which is shown above)
The latest report from the Intergovernmental Panel on Climate Change (IPCC) included for the first time a chapter specifically on weather extremes, whose findings are explained by Carbon Brief.
To read news of the latest catastrophic weather events, check out Headlines from a warming world
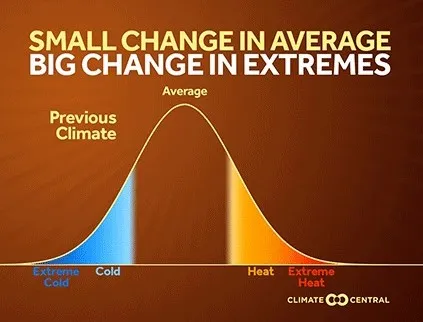
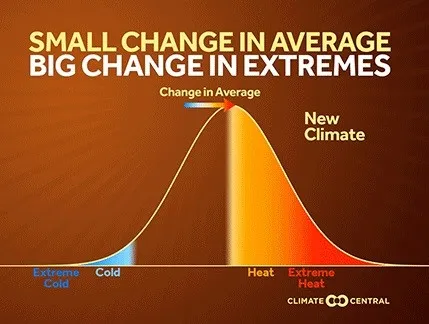
Credit: Climate Central
Unsurprisingly, increased incidence of heatwaves is one of the clearest links between climate change and extreme weather: the IPCC states that it is virtually certain that there has been increases in the intensity and duration of heatwaves and in the number of heatwave days at the global scale. The graph above shows how the number of heatwaves increases as average temperature shifts.
As warmer air can carry more moisture, storms which form above abnormally warm oceans therefore tend to carry a greater load of rain. The most extreme example was Hurricane Harvey in 2017 which formed over unusually warm waters in the Gulf of Mexico. As well as carrying a massive load of water, Harvey was slow moving once it hit land, stalling over the coast of Texas for days. The highest recorded rainfall was over 1.5m over the entire period, and Harvey dropped an estimated 127 billion gallons of water. Such extreme rainfall would only be expected to occur once in 9000 years.
Warm waters also increase the energy and wind speed of hurricanes. Researchers have found that storms are getting stronger in general, and major tropical cyclones are coming more often.
A third way in which climate change is making storms more damaging is that the underlying sea level rise increases the height of the storm surge and how far sea water reaches inland. For Hurricane Sandy in 2012 it was estimated that the damages caused by flooding in New York, New Jersey and Connecticut were $8.1 billion more than they would have been without sea level rise.
Something which can be confusing to non-meteorogists: tropical storms are called hurricanes if they form over the North Atlantic Ocean and Northeast Pacific, cyclones if they form over the South Pacific and Indian Ocean and typhoons if they form over the Northwest Pacific Ocean.
It is not just tropical storms which bring extreme rainfall and flooding, for example the floods in Western Europe last summer were made more likely by climate change. Recent research suggests that climate change may increase the probability of slow-moving intense storms in Europe which have a greater potential to cause serious flooding.
Atmospheric rivers are jets of air that carry huge amounts of water vapour, typically from 400 to 600km wide. When an atmospheric river makes landfall, particularly against mountainous terrain, it releases much of that water vapour in the form of rain or snow, and can cause serious flooding. These storm systems are common -- on average, there are about 11 present on Earth at any time. They are predicted to increase in intensity as the atmosphere heats up.
Droughts have increased in several regions. In most places the driver seems not to be reduced rainfall, but a heat-related increase in evapotranspiration (water that evaporates from land surface plus water released by plants).
The ways in which climate change affects weather patterns can be complex. A continent-sized 'blob' of warm water off the southern coast of Chile is altering the direction of storm tracks, pushing them southward towards Antarctica, and as a result Chile and other South American countries have been suffering a 13 year drought.
As part of natural weather cycles, every few years cooler temperatures in the eastern Pacific cause 'La Niña', with global impacts including less rainfall in East Africa. As the western Pacific has warmed, it has increased rainfall around Indonesia in these years and correspondingly exacerbated droughts in eastern Kenya, Somalia, and Ethiopia.
Another important factor in drought can be a lack of snow. In the western United States, most water arrives in winter storms from the Pacific which leave snow on the region’s mountain ranges which acts as a frozen reservoir, feeding rivers. A shift towards rainfall rather than snow, and earlier snowmelt have caused a significant fall in snowpack on the mountains and a widespread, persistent and worsening drought across a wide region, posing what has been called an 'existential crisis'.
In the long term glacier retreat will reduce water supply across large regions, including much of South Asia and China that rely on Himalyan glaciers, as well as cities dependent on the glaciers of the Andes
It is not surprising that heat and drought, particularly in combination, tend to make wildfires more likely. For example in the southwestern US,there has been an increase in wildfire size and severity. In California, a four-month wildfire season is now six to eight months, and the incidence of large catastrophic fires is rising.
Another major hotspot is Siberia where temperatures have risen around 2-4C rather than the global average of just over 1C. Siberian forests have experienced increasing number and area of.wildfires In 2020 a heatwave brought record temperatures, up to 38C recorded and an estimated 190,000 square kilometres were burnt - the equivalent area of England and most of Scotland. The release of carbon from forest and peat burning is a major concern.
Land management also affects fire risk, for example the use of controlled burns to create breaks. This more detailed review of wildfires and climate change found that the area of grassland burned in Africa has decreased, probably due to conversion of land to agriculture, and this has reduced the global total area burned. However, if temperatures continue to rise, the ability of protective measures to counteract this may be limited. This was found in Australia, where the catastrophic 2019-20 fires 'burned through every protective measure'.
Counterintuitively, drought and wildfire can also increase flood risk when heavy rain does come. Dry soil with less vegetation is less able to absorb rainfall - there is also a greater risk of mudslides or rockslides (as for deforestation in general). This was seen for example with the recent catastrophic floods in British Columbia.
Some regions are particularly vulnerable to both drought and storms bringing catastrophic flooding, for example Mozambique,which has dealt with repeated climate shocks including Cyclone Idai in 2019, followed by three further cyclones in the past two years.
There is also evidence that rainfall is becoming less predictable in general in many regions - bad news for agriculture. Precipitation (rain and snow) variability was found to have increased between the 1960s and the 1990s (illustrated here - full article here)
In general, extreme cold events are now less likely because of underlying warming. But one weather pattern which can cause long stretches of cold as well as heat has been linked to climate change.
Jet streams are fast narrow air currents which flow along the boundaries of adjacent air masses with significant differences in temperature. The northern hemisphere polar jet flows in a meandering path across northern Asia, North America and Europe. Slight changes in its path can push other weather systems around, shifting rainfall away from one area perhaps, or allowing cold air towards another.
The Arctic is warming much more quickly than temperate latitudes. As a result, the north-south temperature difference weakens. It is thought by some scientists that this is affecting the jet stream in two ways. Firstly its path becomes more meandering, with big swings that allow cold air from the Arctic much further south or warm air to reach north. Secondly, these meanders or loops tend to stay in the same place for longer so unusual weather lasts for longer periods. This could be a cold snap, a heat wave, or a storm that, by being held in one place, causes worse flooding.
Because the system is so complex, there is not yet scientific consensus about the theory of 'increased meandering' of the jet stream, and what might happen in future. Ideally this question will remain uncertain, as we end the current global experiment to find out what happens if we continue to burn fossil fuels...
Latest news of extreme weather events can be found at Headlines from a warming world: Extreme weather and climate breakdown